AI Innovations

Explore our advanced AI platform for learning and analysis.

Data Insights

Our platform provides deep insights into data usage and trends, empowering businesses to make informed decisions and enhance their operational efficiency through advanced learning algorithms and analytical tools.

Four small, white robot figures are sitting in a row, each with a laptop in front of them. They have round bodies and blue accents, with 'AI' displayed on their chests. The background is minimal and light gray, emphasizing the robots and their computers.
Learning Tools

We offer a suite of learning tools designed to facilitate AI-driven knowledge acquisition, enabling users to harness the full potential of artificial intelligence for their business needs and growth.

Gallery

A glowing neon sign displaying the letters 'AI' is mounted on a dark, textured wall that resembles a circuit board or technological pattern.
A digital screen displaying analytical data with line graphs, histograms, and numerical values. The data is presented in a user-friendly interface with different shades of blue used to distinguish various elements.
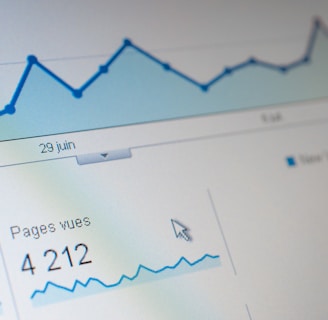
A computer screen displaying a data analytics dashboard with graphs and charts. A blue line graph shows fluctuations in data over time, and a section highlights the number of page views. A pie chart is partially visible, indicating a breakdown of different data elements.

Explore our AI platform's innovative learning and analysis solutions.